Features

Everything Ocular VMS does, shown as it really looks

The images on this page are taken from the running application with sample data for a fictitious warehouse and office. There are no add-on modules: one license unlocks every feature below.

Start a free 7-day trial Read the user guide

A video wall straight from your NVRs

Up to 16 cameras per screen as live sub-stream video, or snapshot mode, the lightest option for busy NVRs. Filter by area, category, or NVR, then bookmark the view for the control room monitor.

  • 1, 2×2, 3×3, 4×4 grids and automatic page rotation
  • One camera full screen on the main stream (HD) with digital zoom
  • H.265 sub-streams can be switched to H.264 from the application, without opening the NVR
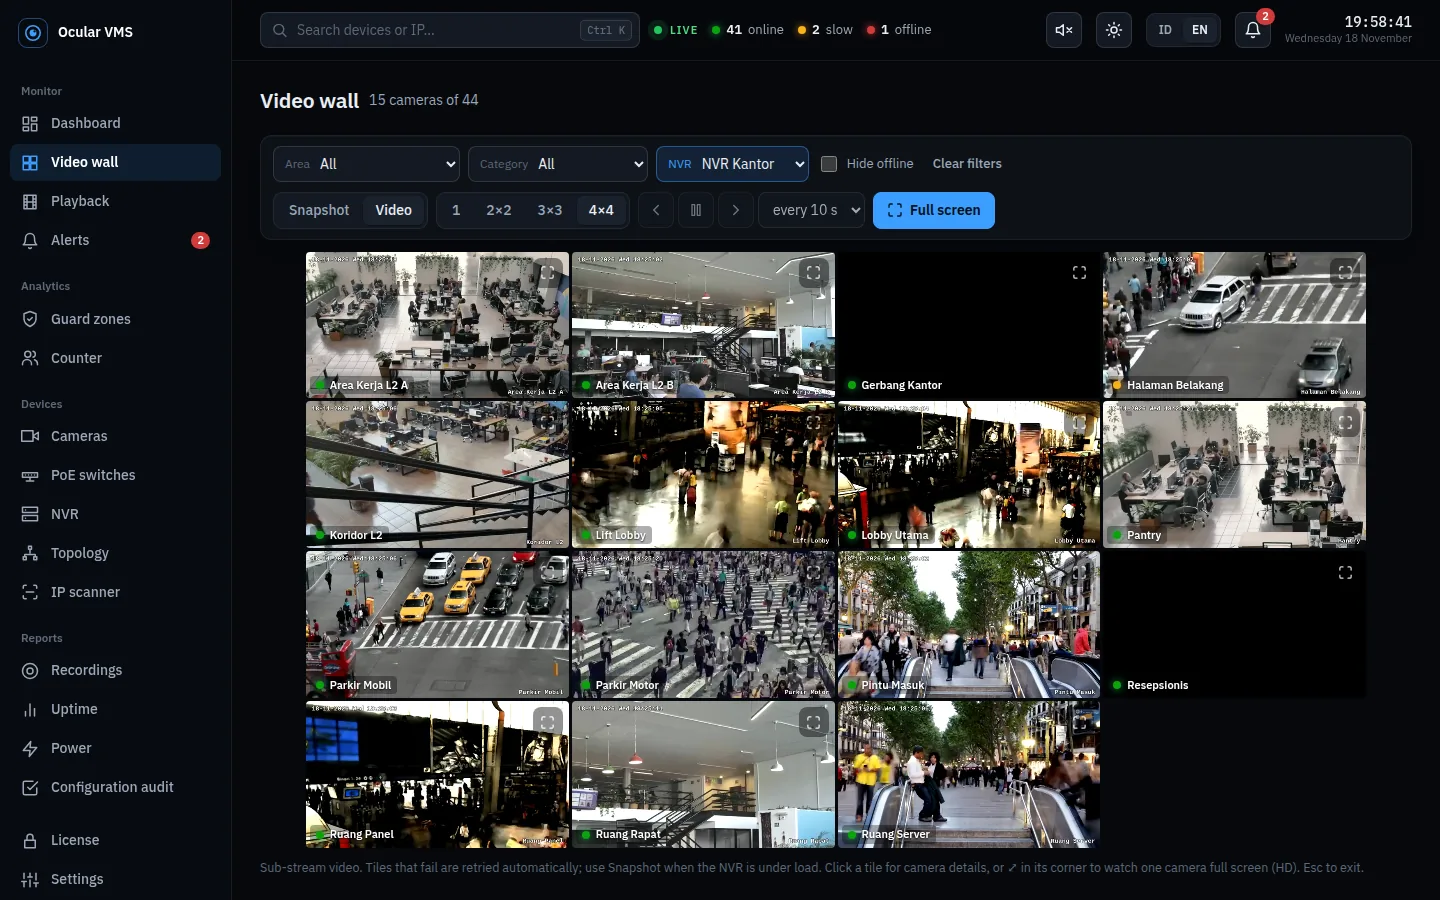
4x4 video wall with live video from office cameras

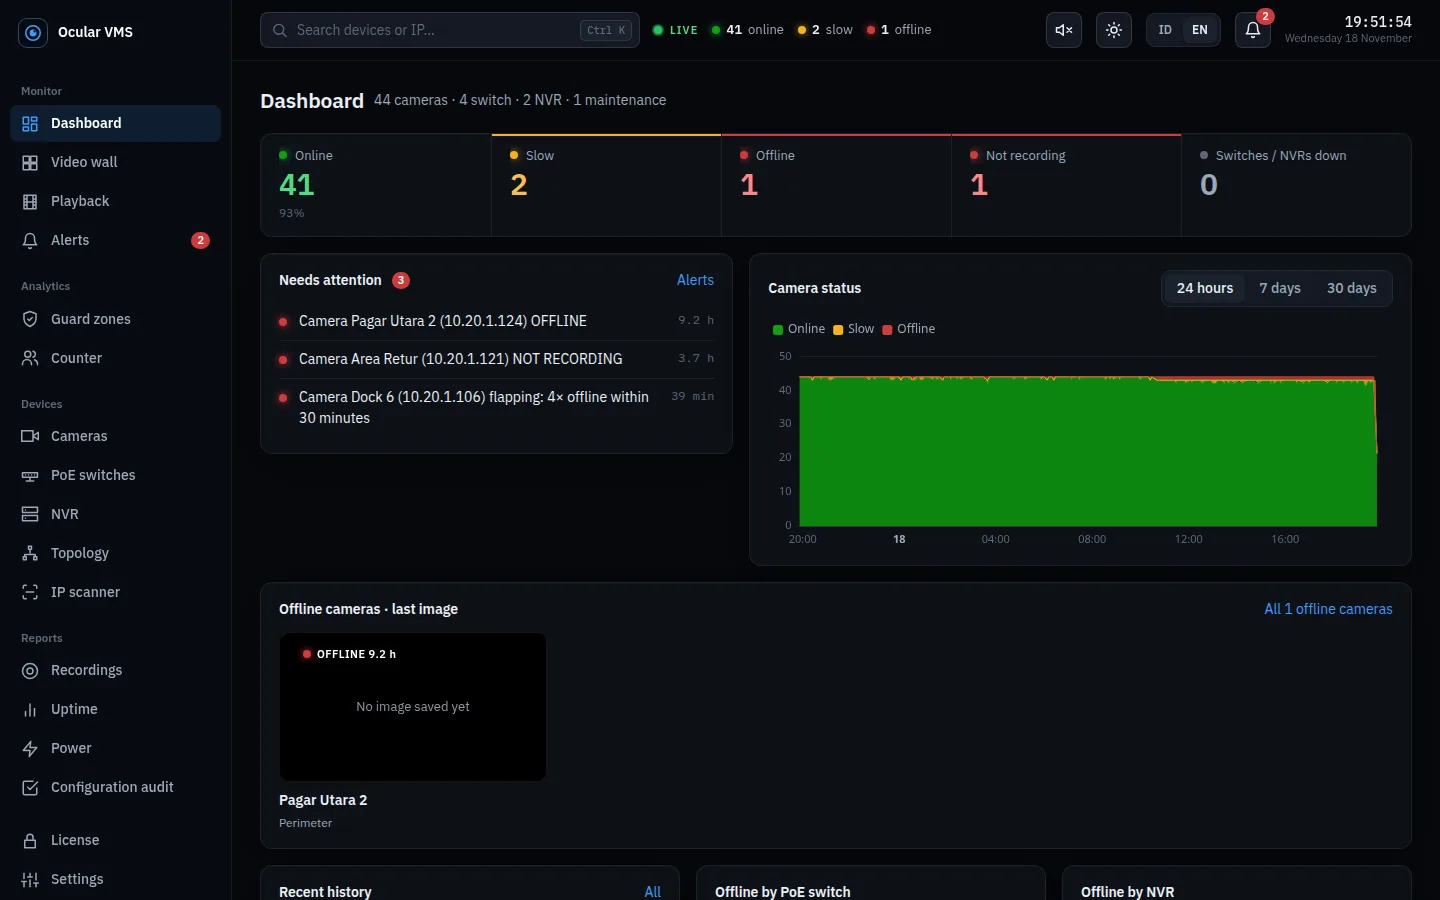
A dashboard that points at the problem

Online, slow, offline, and not-recording counts in one row; a list of what needs attention; a status chart from 24 hours to 30 days; and the last image of every camera that went down, so an unwatched area is recognised at once.

Dashboard: camera status counters, needs attention list, and status chart

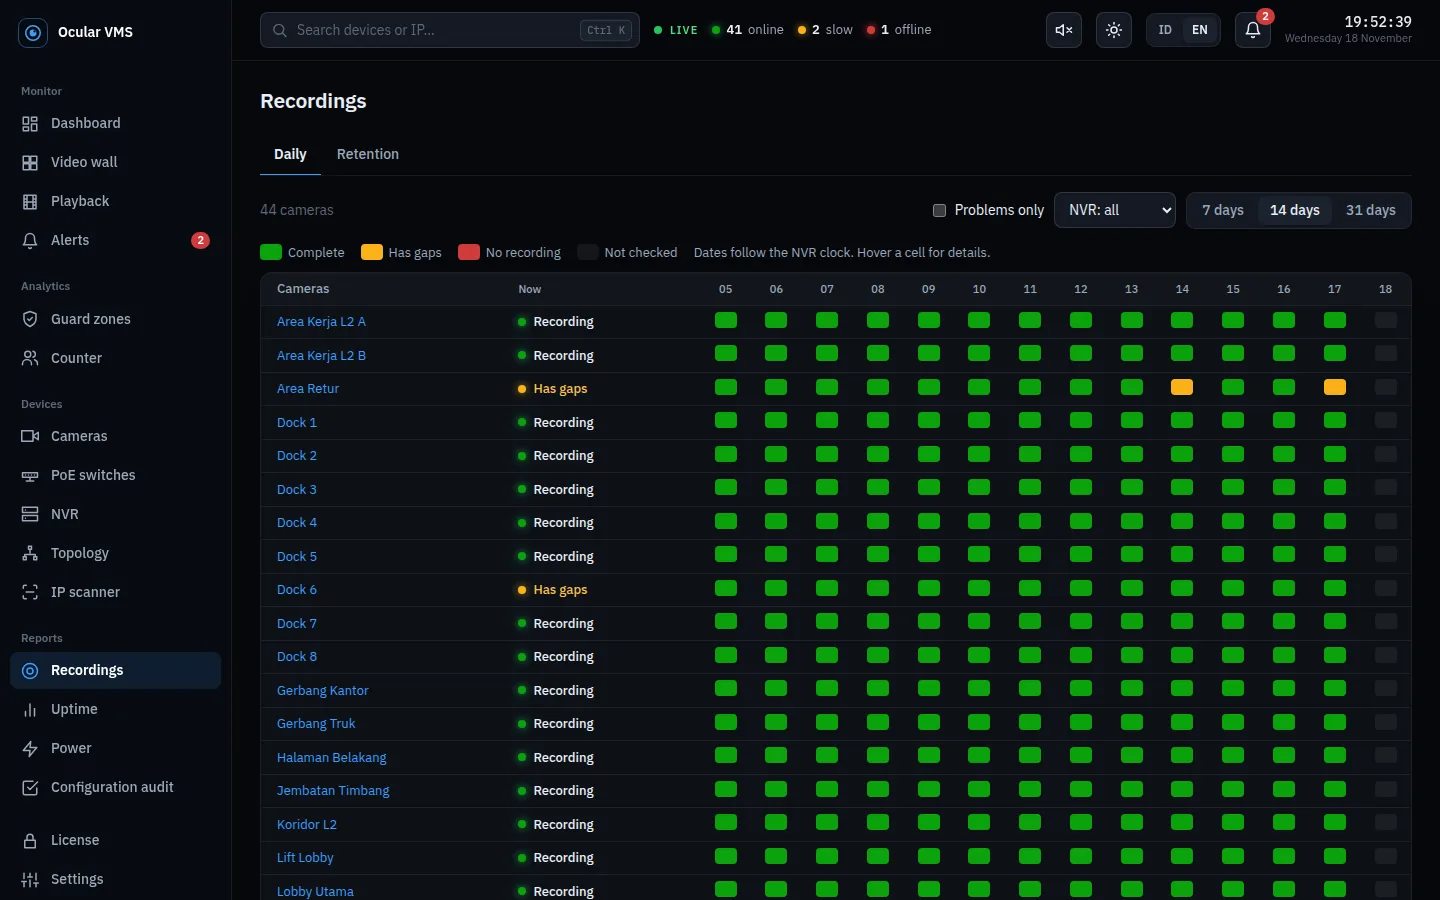
Recording status for every camera, every day

Every 15 minutes the NVR is asked directly over ISAPI when each camera last recorded and whether there are gaps. Results are kept per day, so missing footage is found before an incident needs it.

  • Recording, gaps, or not recording per camera per day
  • Retention: oldest footage and missing days per camera
  • NVR recording schedule: 24/7, partial, events only, or unscheduled
Daily recordings: camera by day table

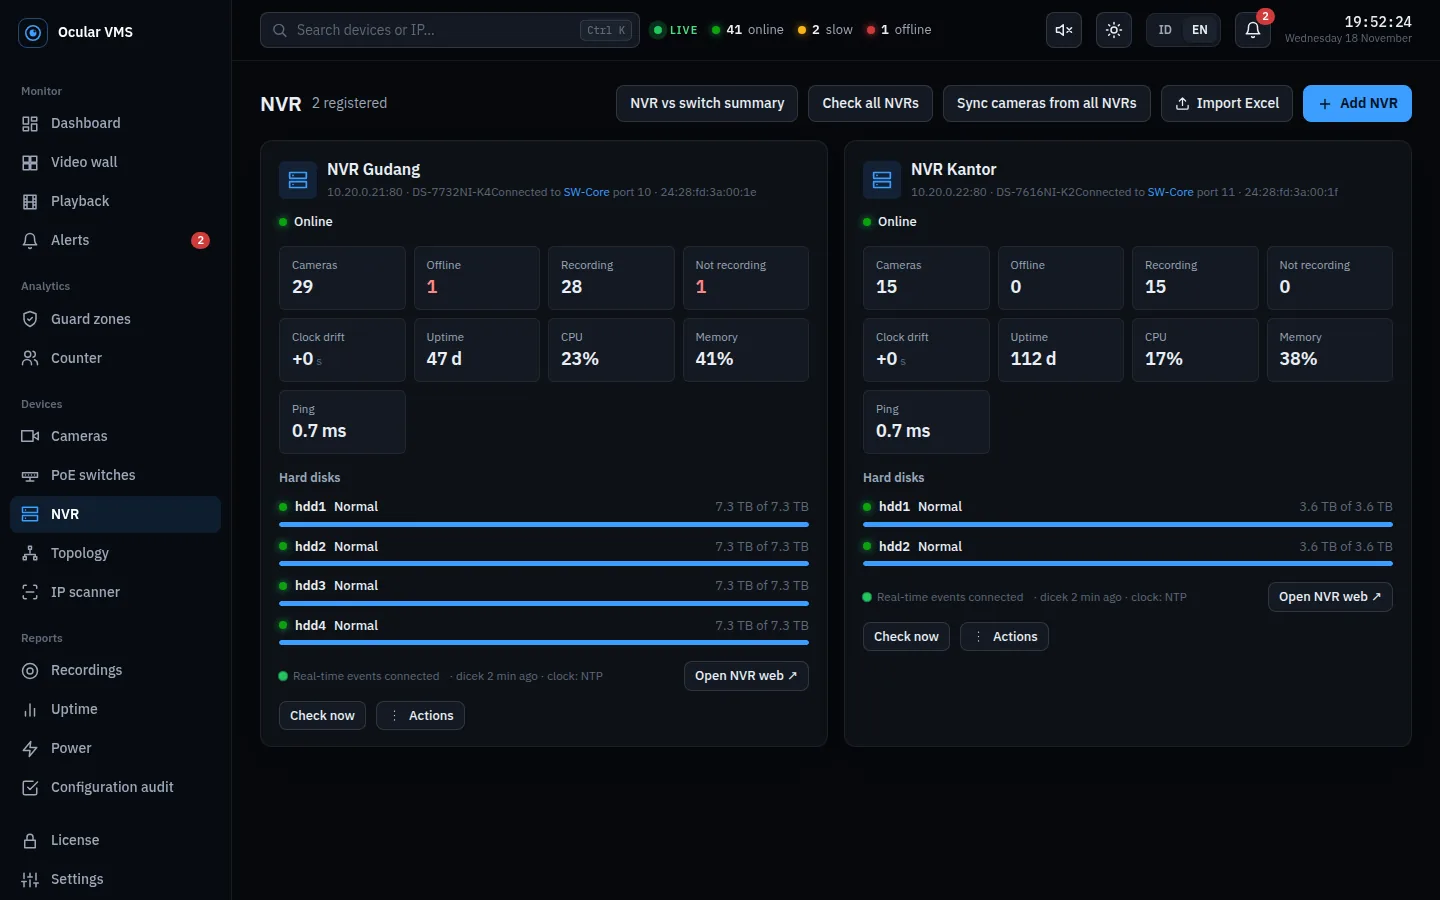
NVR and hard disk health

Status and usage of every disk, daily SMART results (healthy, warning, failing), CPU and memory load, uptime, and the NVR clock offset from the server. A failing disk shows up before its footage is lost.

NVR cards with hard disks, uptime, CPU, memory, and clock drift

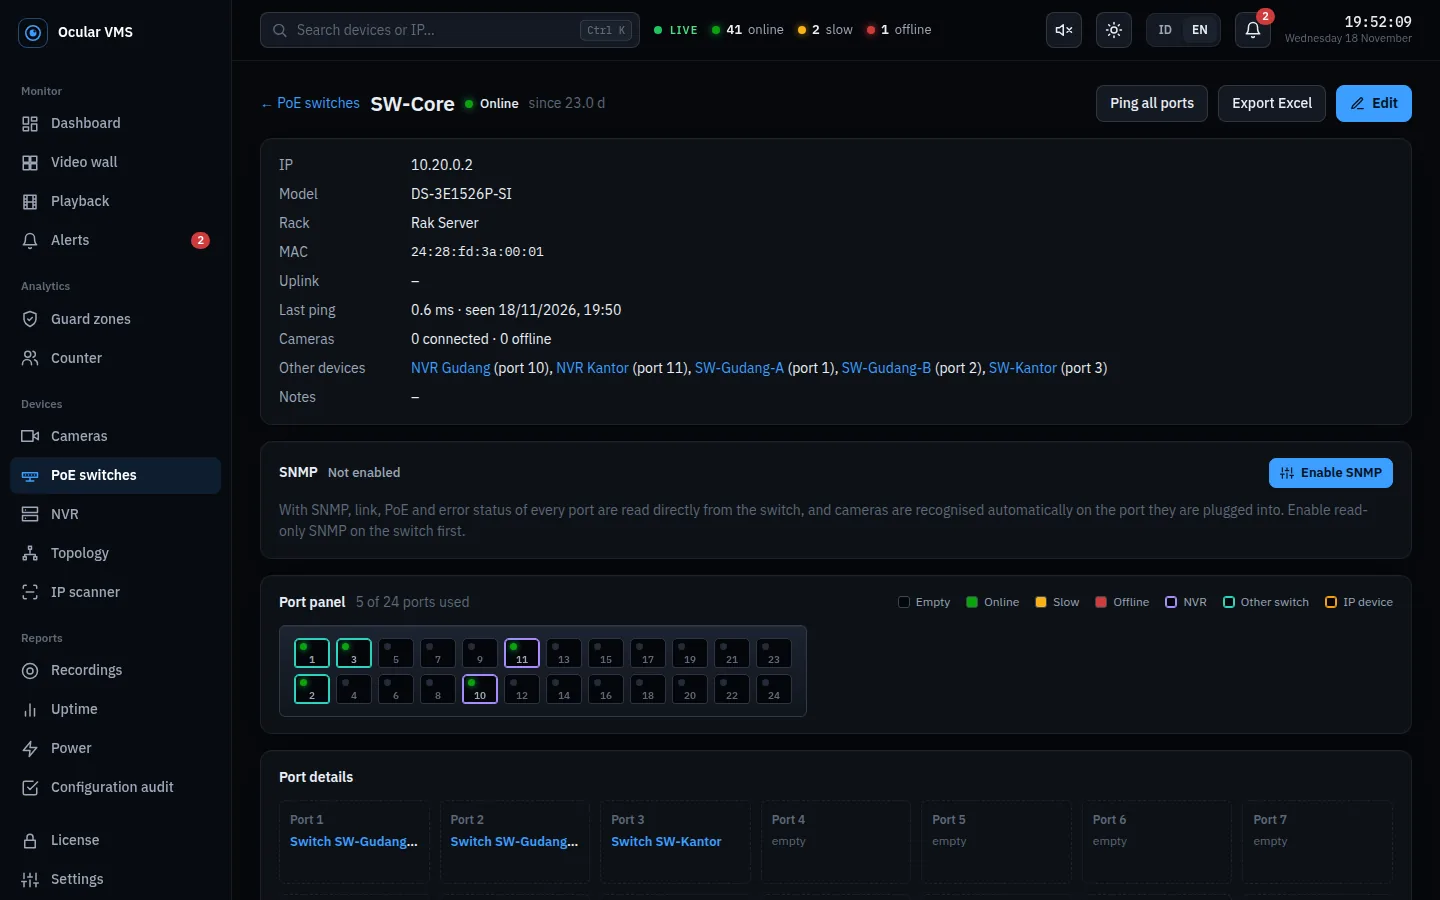
PoE switches, port by port

Managed switches are read over SNMP v2c or v3: link and speed per port, PoE status, errors, traffic, and connected devices. Unmanaged switches are still monitored by ping. The lights on the port panel follow the status of the camera on each port.

  • Camera ports filled in automatically from MAC and LLDP tables
  • Cameras whose link is up but send no video are flagged
  • Read-only; switch settings are never changed
Switch details with port panel and port details

Topology and the path to the NVR

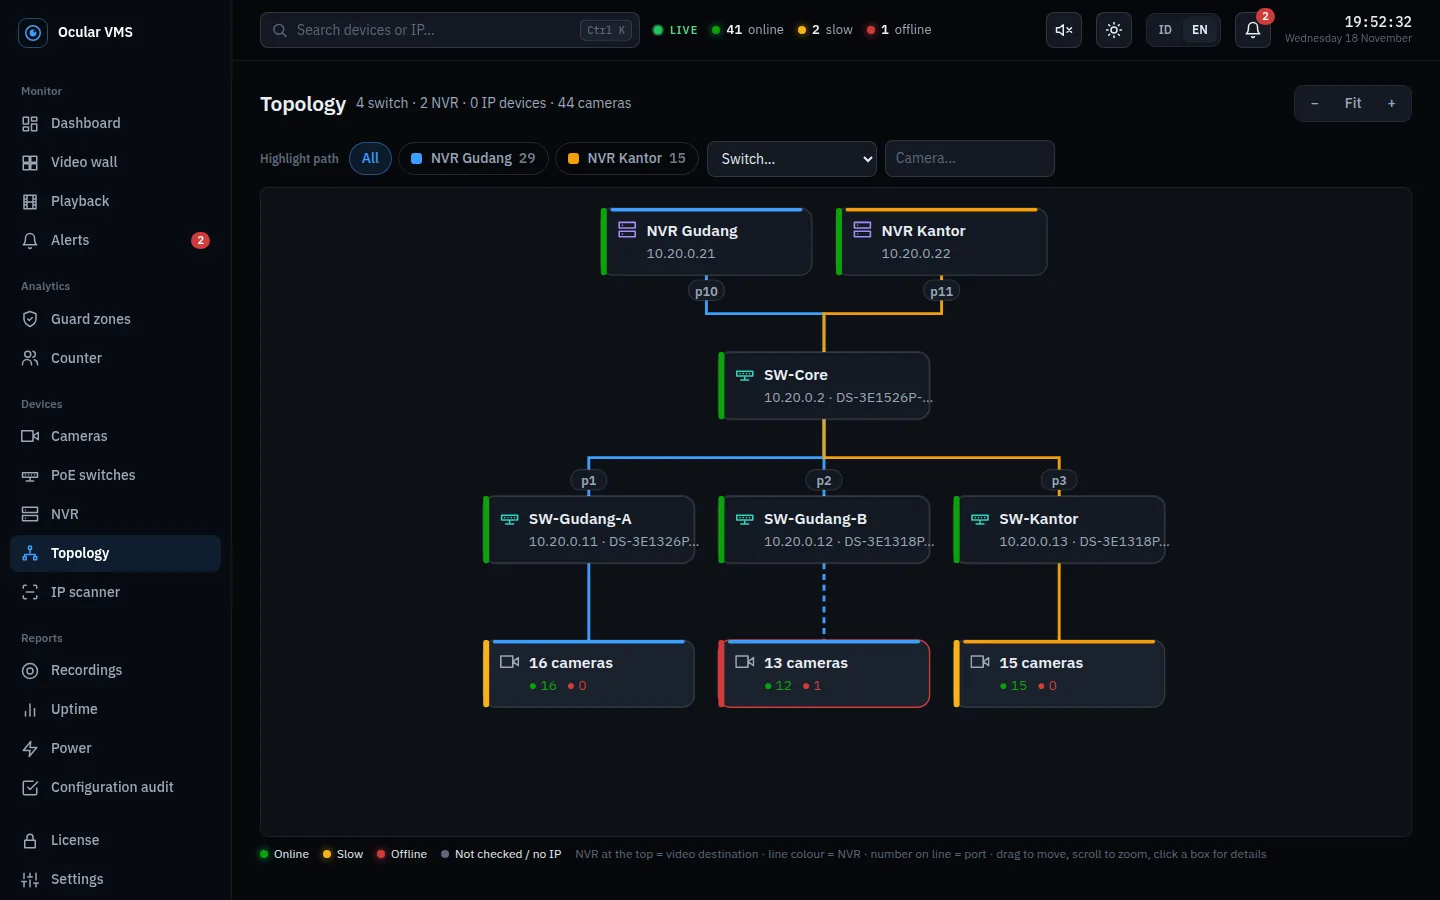
A diagram of NVRs, switches, and cameras laid out from your uplink data. Highlight one camera to see its path to the NVR, port by port. When a switch goes down, every camera behind it is reported as one switch problem, not dozens of alerts.

Topology of NVRs, core switch, access switches, and camera groups

Alerts you can act on

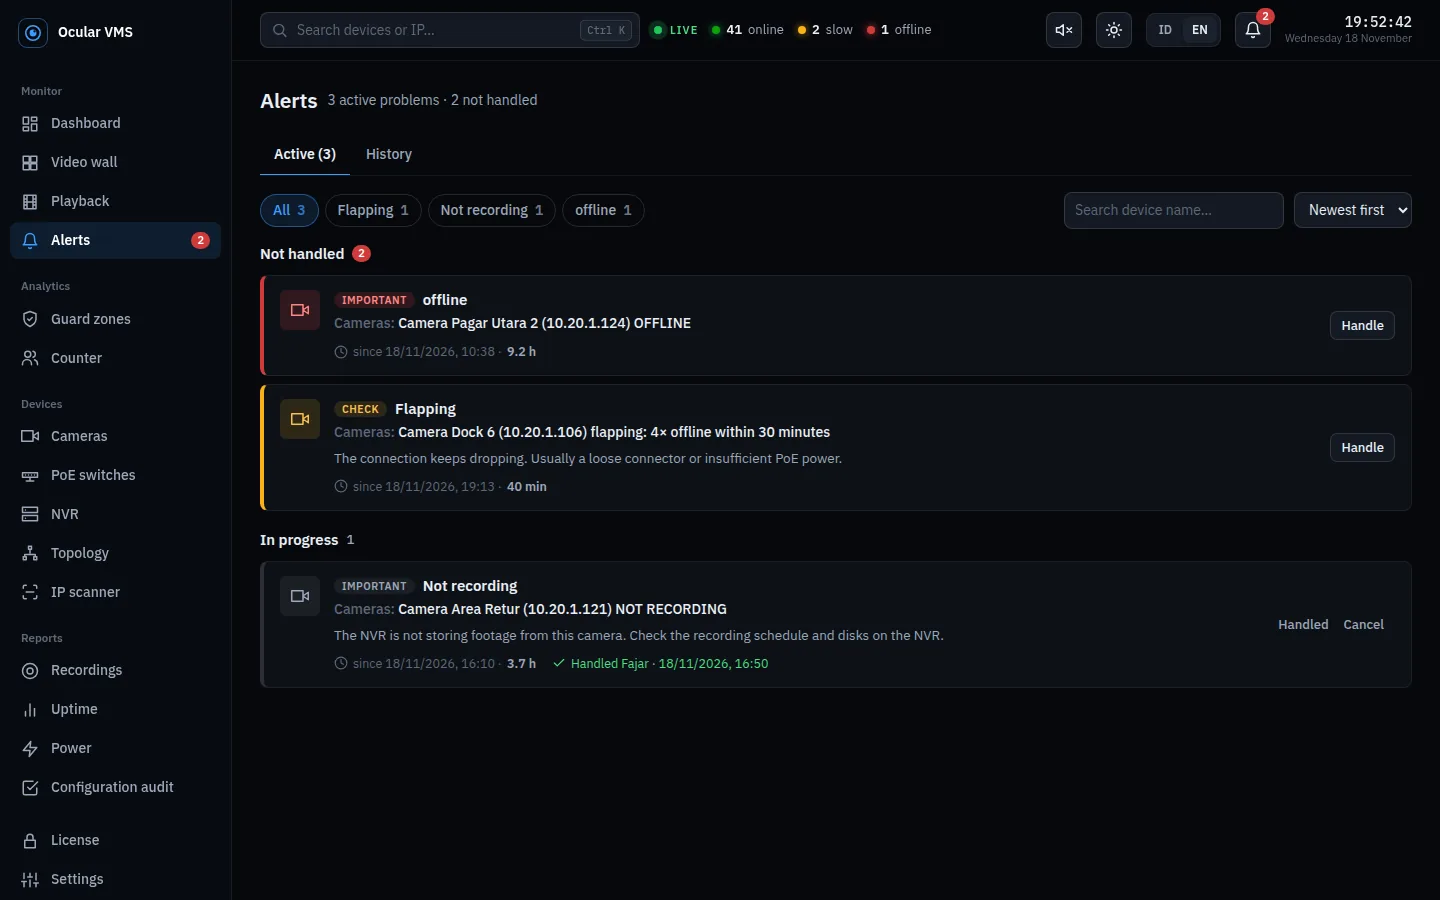
Each alert says what happened, on which device, what to check, and since when. Sound and notifications on the control room computer, messages to a Telegram group, and real-time NVR events such as a covered camera or a disk error.

  • Mark "being handled" with a technician's note
  • History with mean time to repair and the devices with the most problems
  • One problem, one alert: cameras behind a dead switch do not flood the list
Alerts page with active problem cards

Complete details for every camera

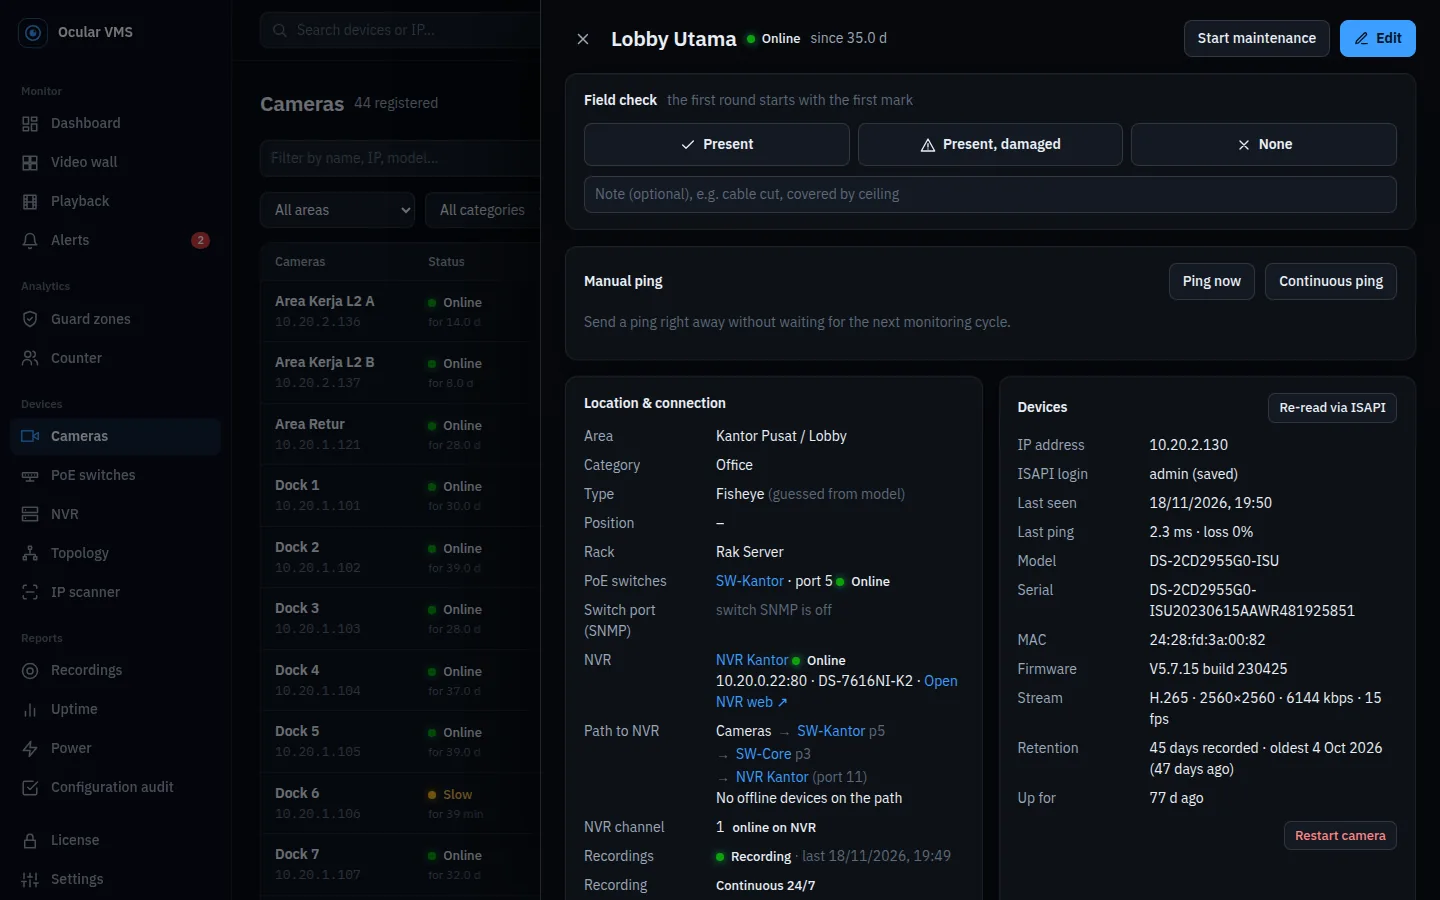
Location, rack, switch and port, NVR and channel, network path, model, serial, MAC, firmware, stream settings, and retention in one panel. Manual and continuous ping for technicians on site, latency charts, status history, a recording calendar, and a repair log.

Camera detail panel

Find and activate new devices

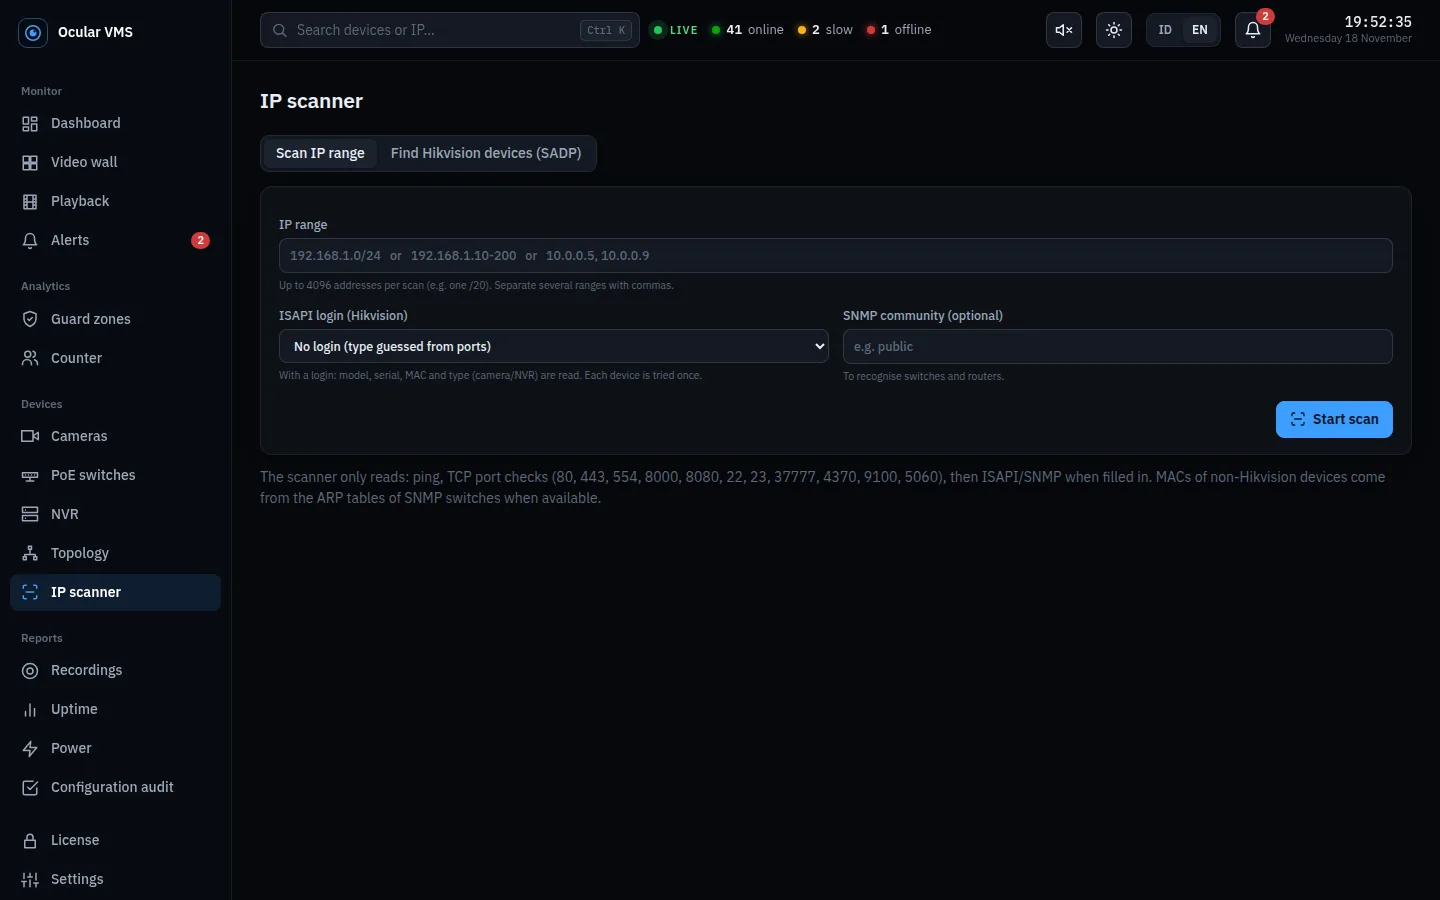
The IP scanner finds devices in an IP range and recognises their type. SADP search finds Hikvision devices on the same network without knowing their IP, flags IP conflicts and inactive devices, and activates them right from the browser.

IP scanner with IP range and ISAPI login

Uptime reports and configuration audit

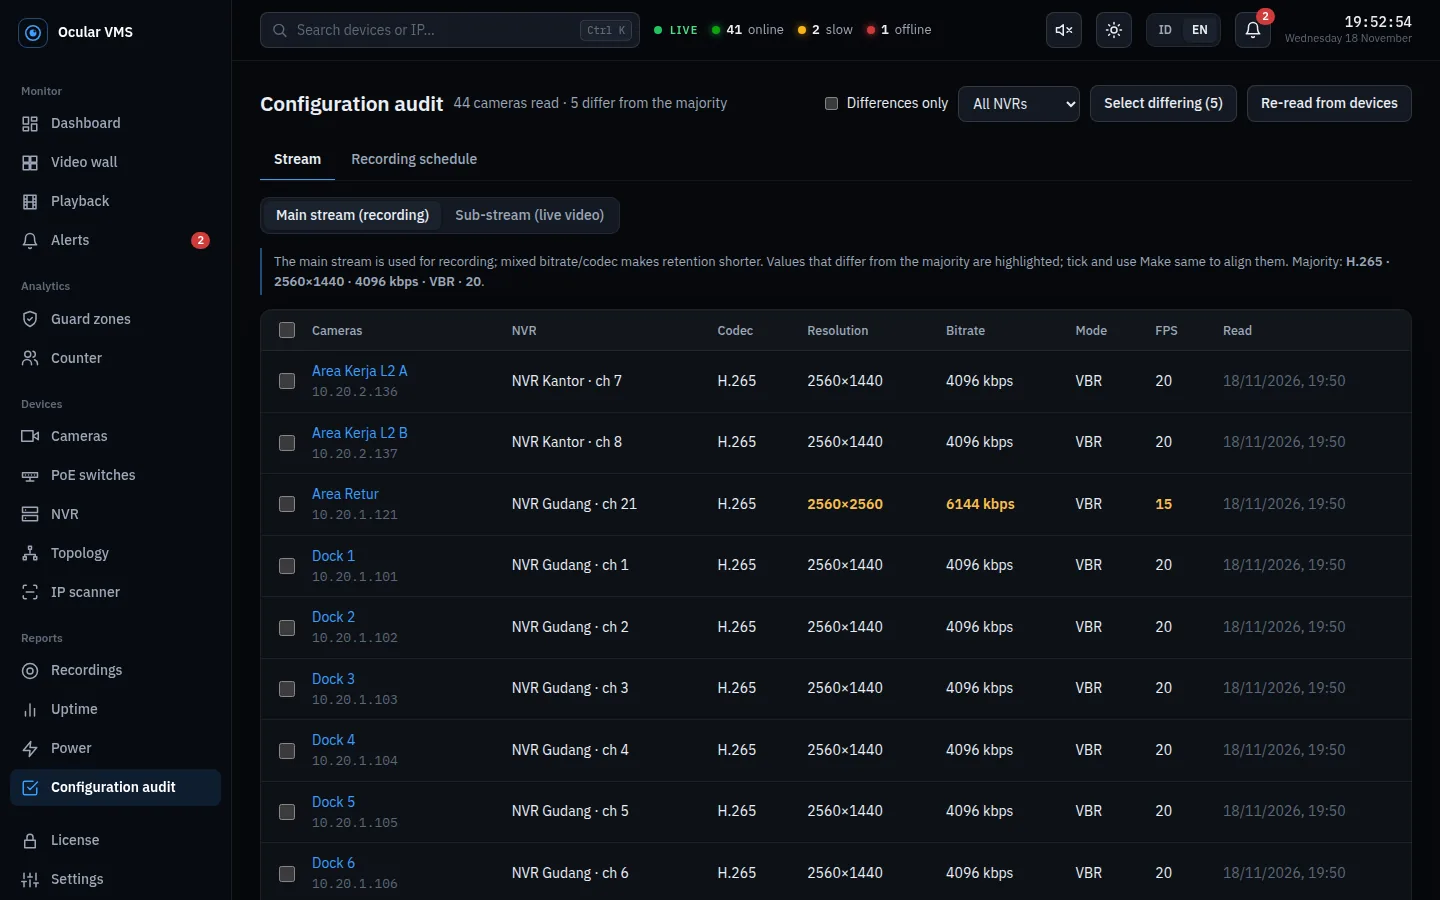
Uptime for every camera from 24 hours to 90 days, with incidents and offline time. The configuration audit compares codec, resolution, bitrate, and FPS across all cameras, then aligns them over ISAPI in one click.

Stream configuration audit across all cameras

CCTV electricity cost

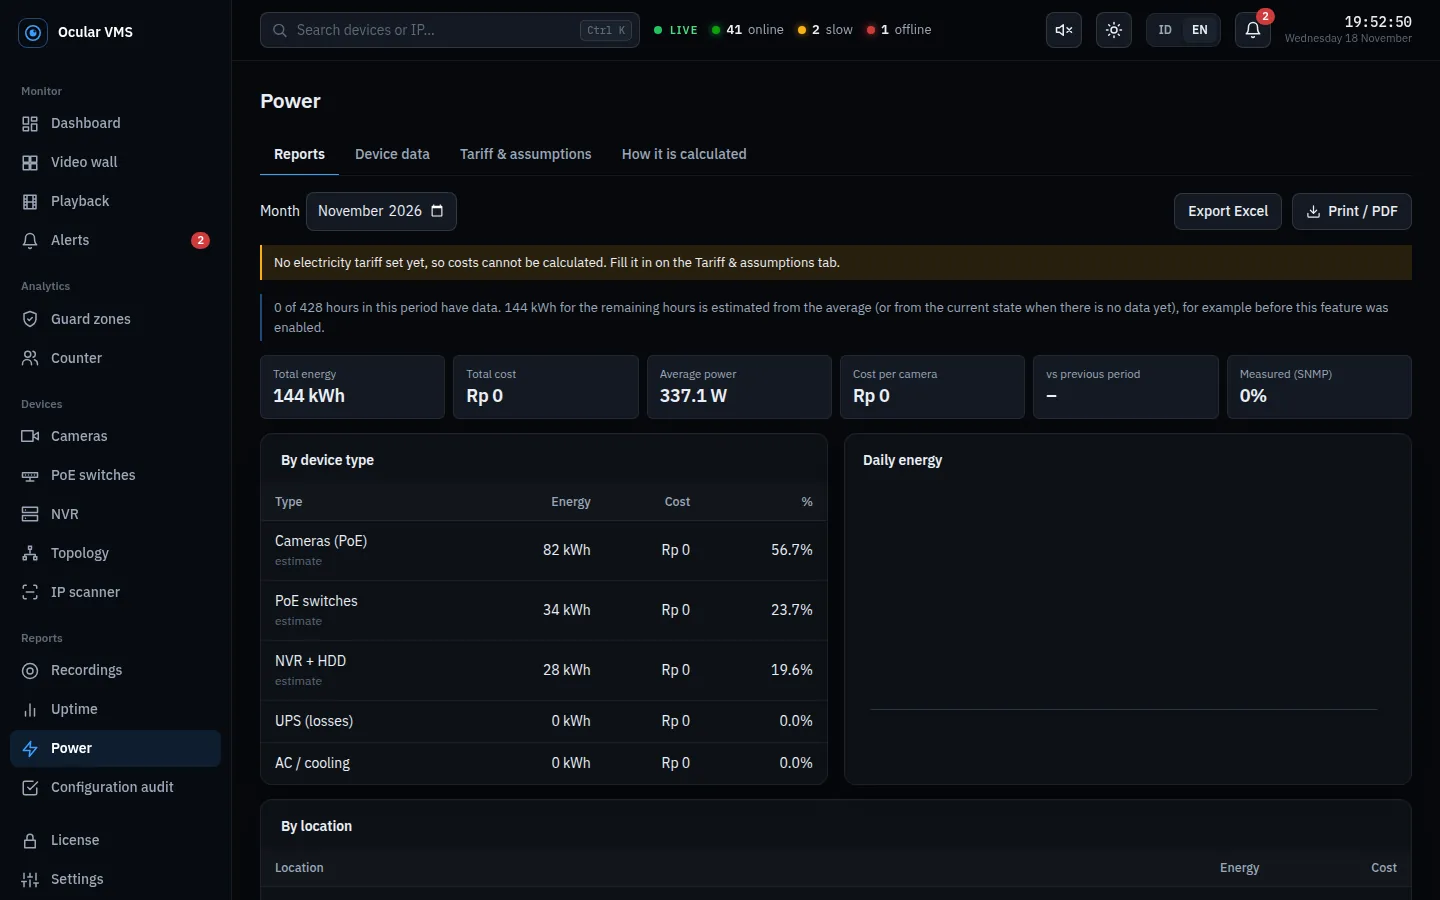
A monthly report of the energy use and cost of cameras, switches, NVRs, UPSs, and air conditioning, with a single tariff or peak/off-peak pricing. PoE camera power is measured from the switch where available, the rest from datasheets. Ready to export to Excel or print.

Monthly power report

More features

Playback and evidence

  • Play 1–4 cameras at the same time of day
  • Up to 8× speed, digital zoom, save image
  • Download original NVR clips with SHA-256 fingerprints

Local analytics

  • Count people and vehicles by line or area
  • Guard zones: video pops up when someone enters a restricted area
  • Runs on the server CPU, with no internet and no face data

Field work and reports

  • Field checks from a phone: present, damaged, or missing
  • Offline report on A4 and a handover report per switch
  • Excel import and export for cameras, NVRs, and switches

Administration

  • Admin and view-only accounts, full activity log
  • Automatic daily backups and before every update
  • Indonesian and English interface, light and dark themes

Start a free 7-day trial See pricing